
Facts:
- Unemployment continued to drop. This month’s unemployment rate came in at 8.4%, compared to last month’s 10.2%.
- PMI (Purchasing Managers Index) continued to expand. This month’s reading came in at 56, compared to last month’s 54.2.
- The S&P 500 (C Fund) increased 7.19% during the month of August. This marks 5 months of consecutive growth, with a YTD return of 9.67%!
- The Fed Funds interest rate remains between 0% – 0.25%, and the Fed suggested that such rates will hold thru 2023.
- The 2nd Q2 GDP estimate shows GDP dropping – 31.7%, as opposed to the original estimate of -32.9%.
Assessment:
The above performance suggests the economy is healing from its wounds.
Concern:
A point I am concerned with and monitoring is housing. The amount of defaults, evictions, and foreclosures is being stalled by the government. The government stalling may expire in the near future. That’s not a problem, unless people are still being prevented from working. If that happens, many unemployed people will be evicted with no place to go (unable to rent because they are still being prevented from working), and/or landlords may not be able to find tenants, and thus unable to collect rents, causing them to default on their loans. If both of these happen we will have a weird situation of plenty of empty properties but no one employed to rent them. This will cause many properties to be put on the market, an over-supply, which in turn will cause housing prices to go down. This may also cause a credit crunch, as lenders will ultimately feels the burn of defaults, leading to tightening of lending and increased costs of borrowing.
Hopefully, the government can coordinate their efforts and allow people back to work before releasing the pent up housing forbearance rules. I’ll keep track of new market-impacting policy and keep you posted.
The GDP numbers were not a surprise. The market already knew this and is looking beyond the immediate drop, into the future.
ELECTION COMMENTARY from last month: Below are the election charts I shared last month. The market doesn’t seem to make presidential elections as dramatic as the media does.
Also, even if there is a new president, that won’t necessarily make-or-break things. But, if/when a new president passes economically devastating policy (such as a Green New Deal or a variation of Socialism), then the markets will respond. But we will have to wait to see if such proposals come.
Here’s a collection of market responses to elections dating back to 1980:

• The Red Lines Represent the market performance YTD prior to the 100-day pre-election performance.
• The Blue Lines represent the market performance during the 100-days pre-election.
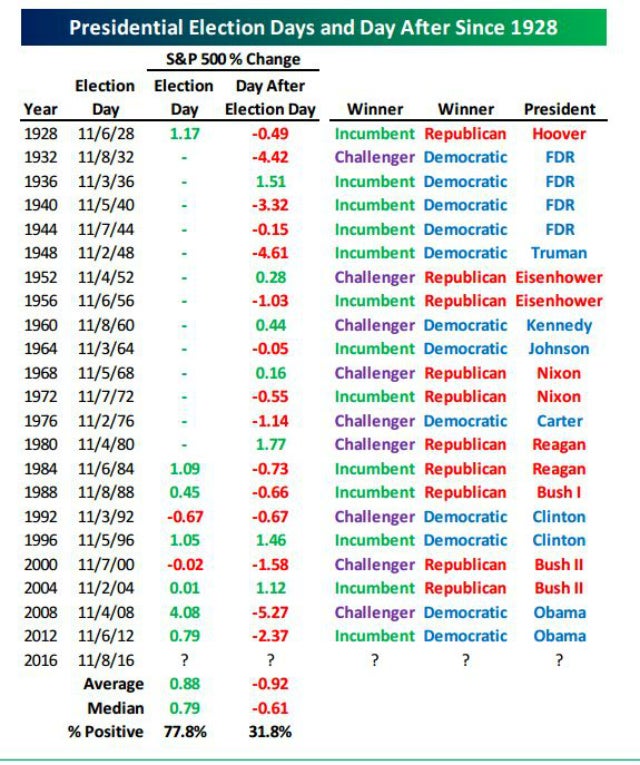
For those who want to see what happens the day of- and the day after elections, here is a graph:

source
Notice how most of the movement the day of is corrected the day after.
Bottom Line:
The market is recovering. That’s good.
Regarding Covid-19: So long as governments don’t interfere, the markets should recover and blossom. Spikes in Covid-19 cases will not drive the market down.
Regarding housing: I think we need more time and data on that one. The market doesn’t seem to be reflecting the concern I’m having, just yet.
Regarding election: It’s a distraction that costs nervous investors more than it saves. Find another hobby for the next couple months.
Below are my recommended portfolios for this month

